

External links |
MINBAR /
Cross CalibrationThis page describes the instrumental cross calibration. This is performed separately for bursts and observations ObservationsThe routine We consider a minimum overlap fraction of $ f=0.1 $, where $ f=\Delta t_\mathrm{overlap}/(t_\mathrm{max}-t_\mathrm{min}) $, $ \Delta t_\mathrm{overlap} $ is the time in common to both instruments, and $ t_\mathrm{min} $, $ t_\mathrm{max} $ represents the maximal extent of the two observations. We then calculate a linear cross-calibaration between the two instruments, following a single iteration of outlier detection. We use the Bayesian method of Kelly et al. (2007) to derive the linear correlation coefficients; this method takes into account the errors in both x and y, as well as any possible correlation of the errors. The results are as follows. RXTE-WFClast updated 2015 October 29 We cross-correlate the count rate separately to the flux. 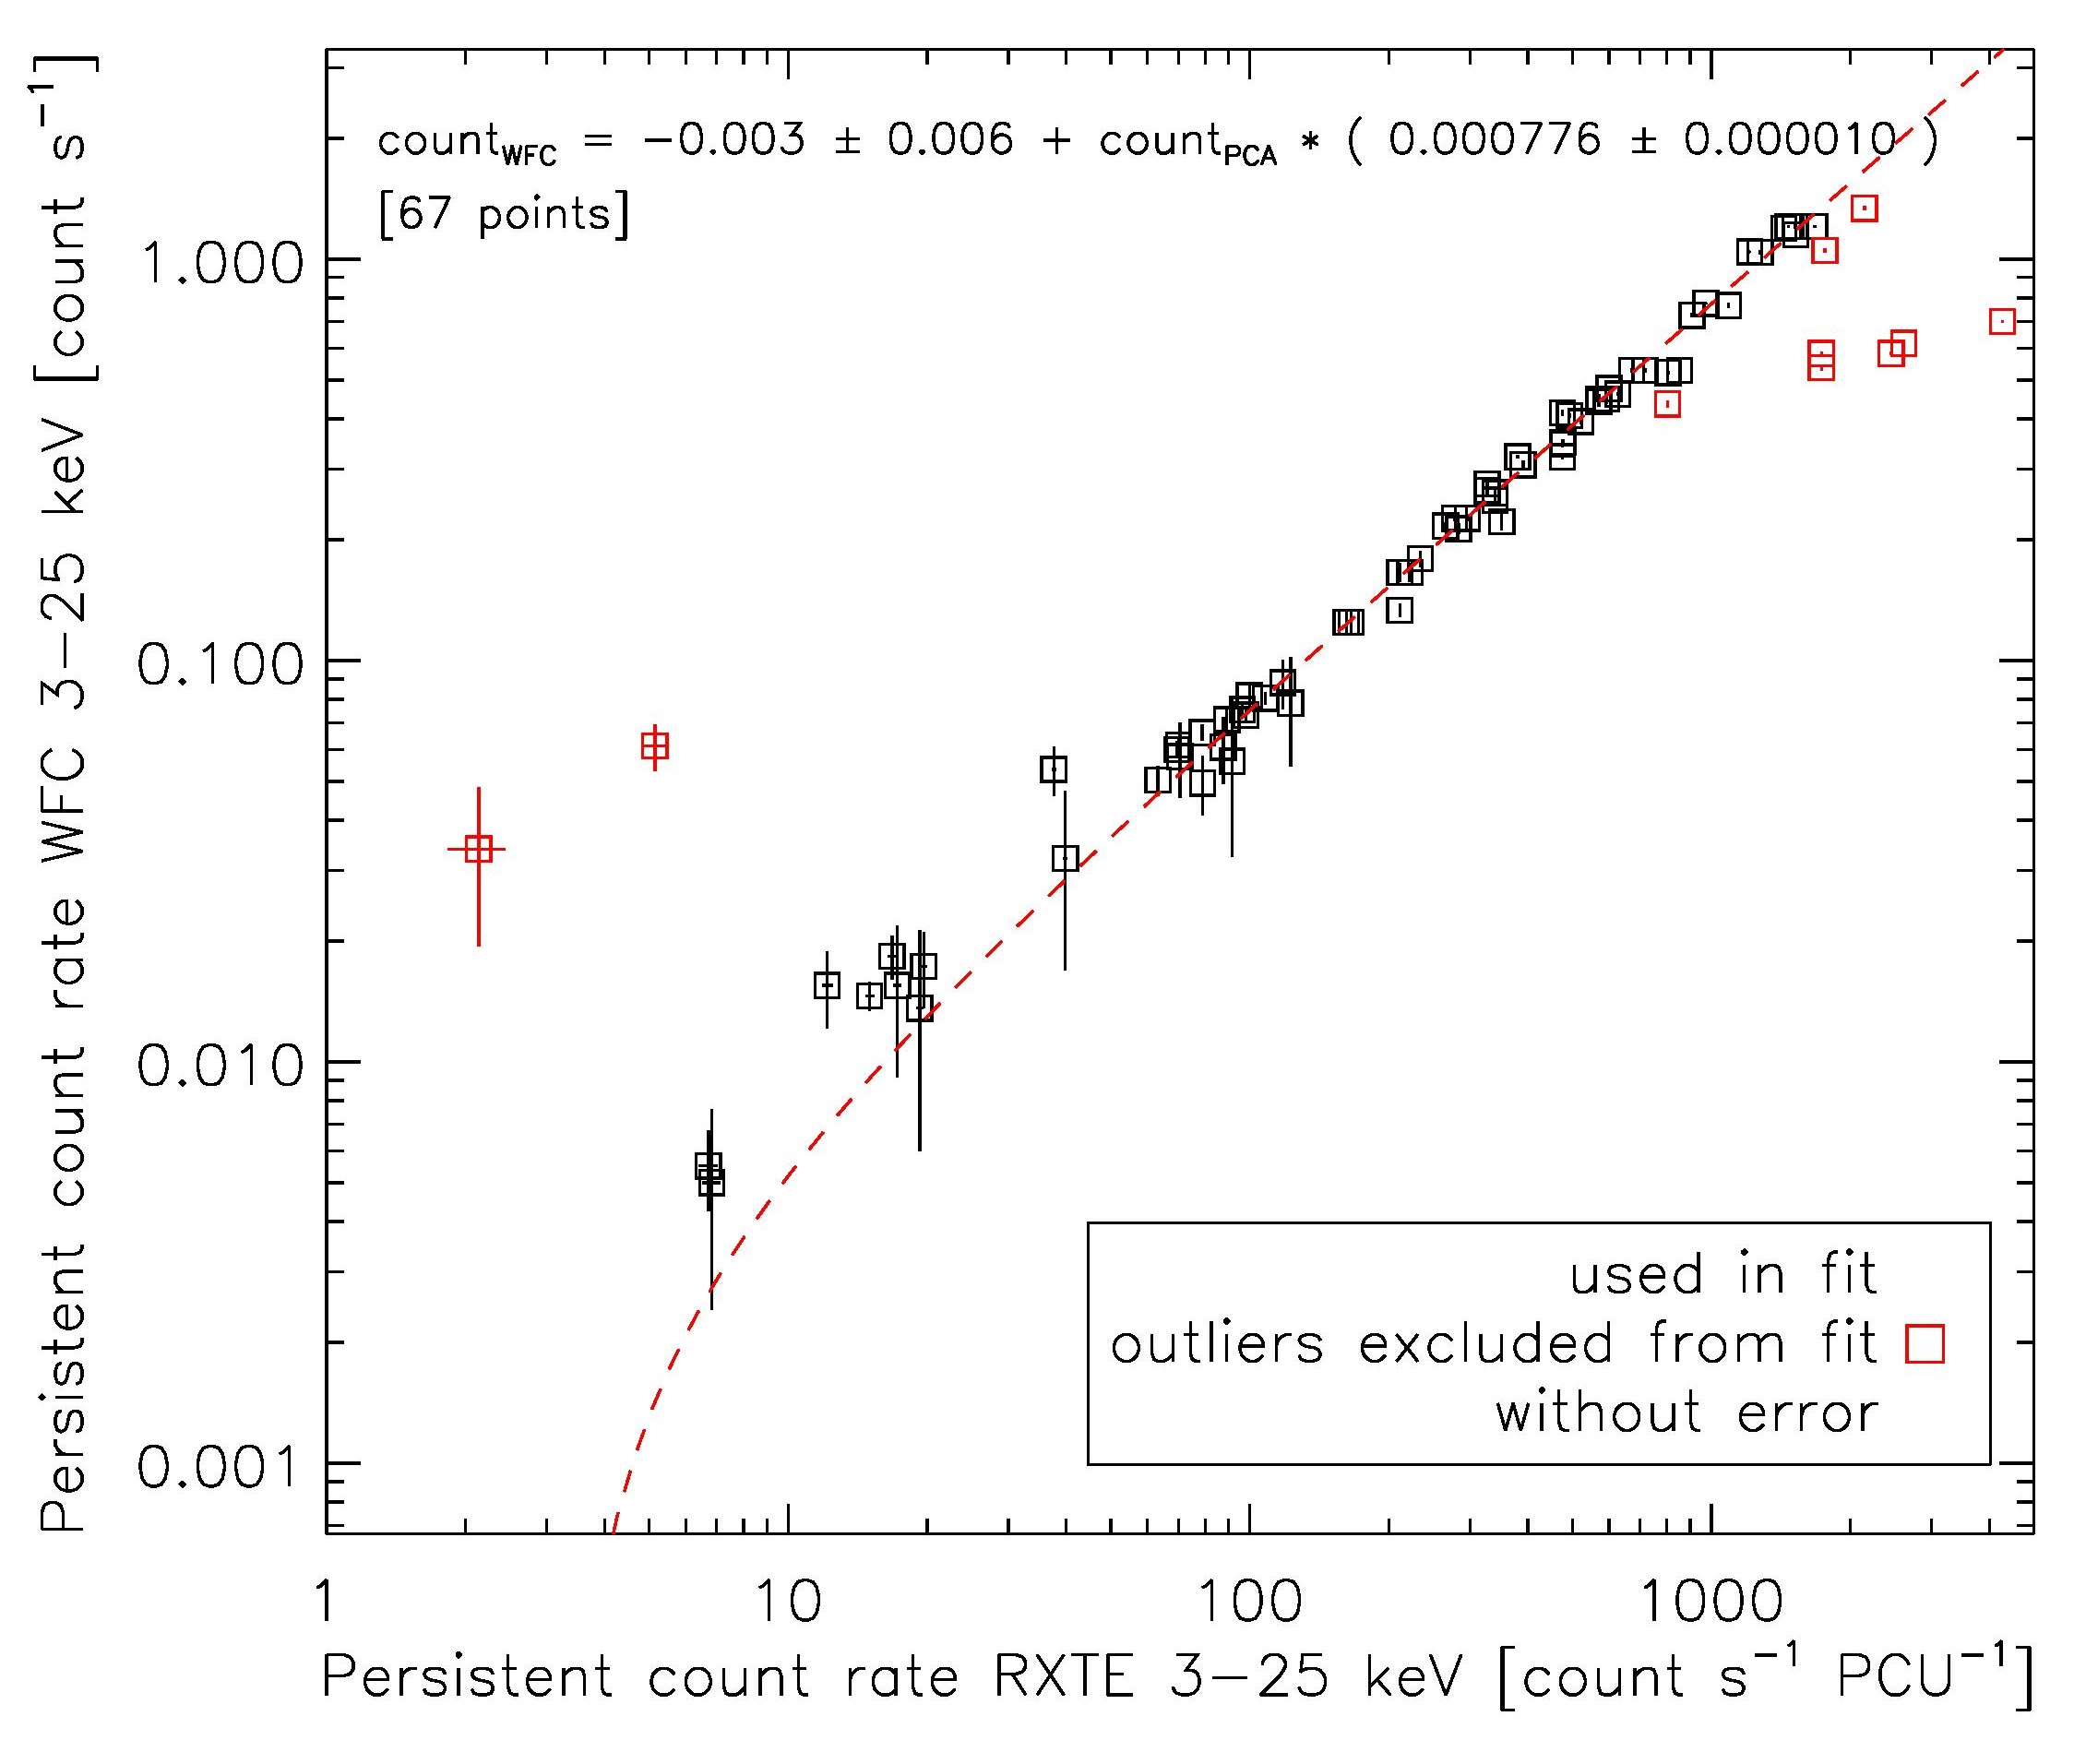 The points marked in red are identified as outliers, and are excluded from the linear fit, which gives: $ c_\mathrm{WFC} = (-0.003\pm0.006) + c_\mathrm{PCA} \times ( 0.000776\pm0.000010) $ The inverse proportionality factor is $ 1288\pm17 $, which is consistent with the value of 1300 assumed for the light curve fits to convert c/s/PCU to c/s/cm2. 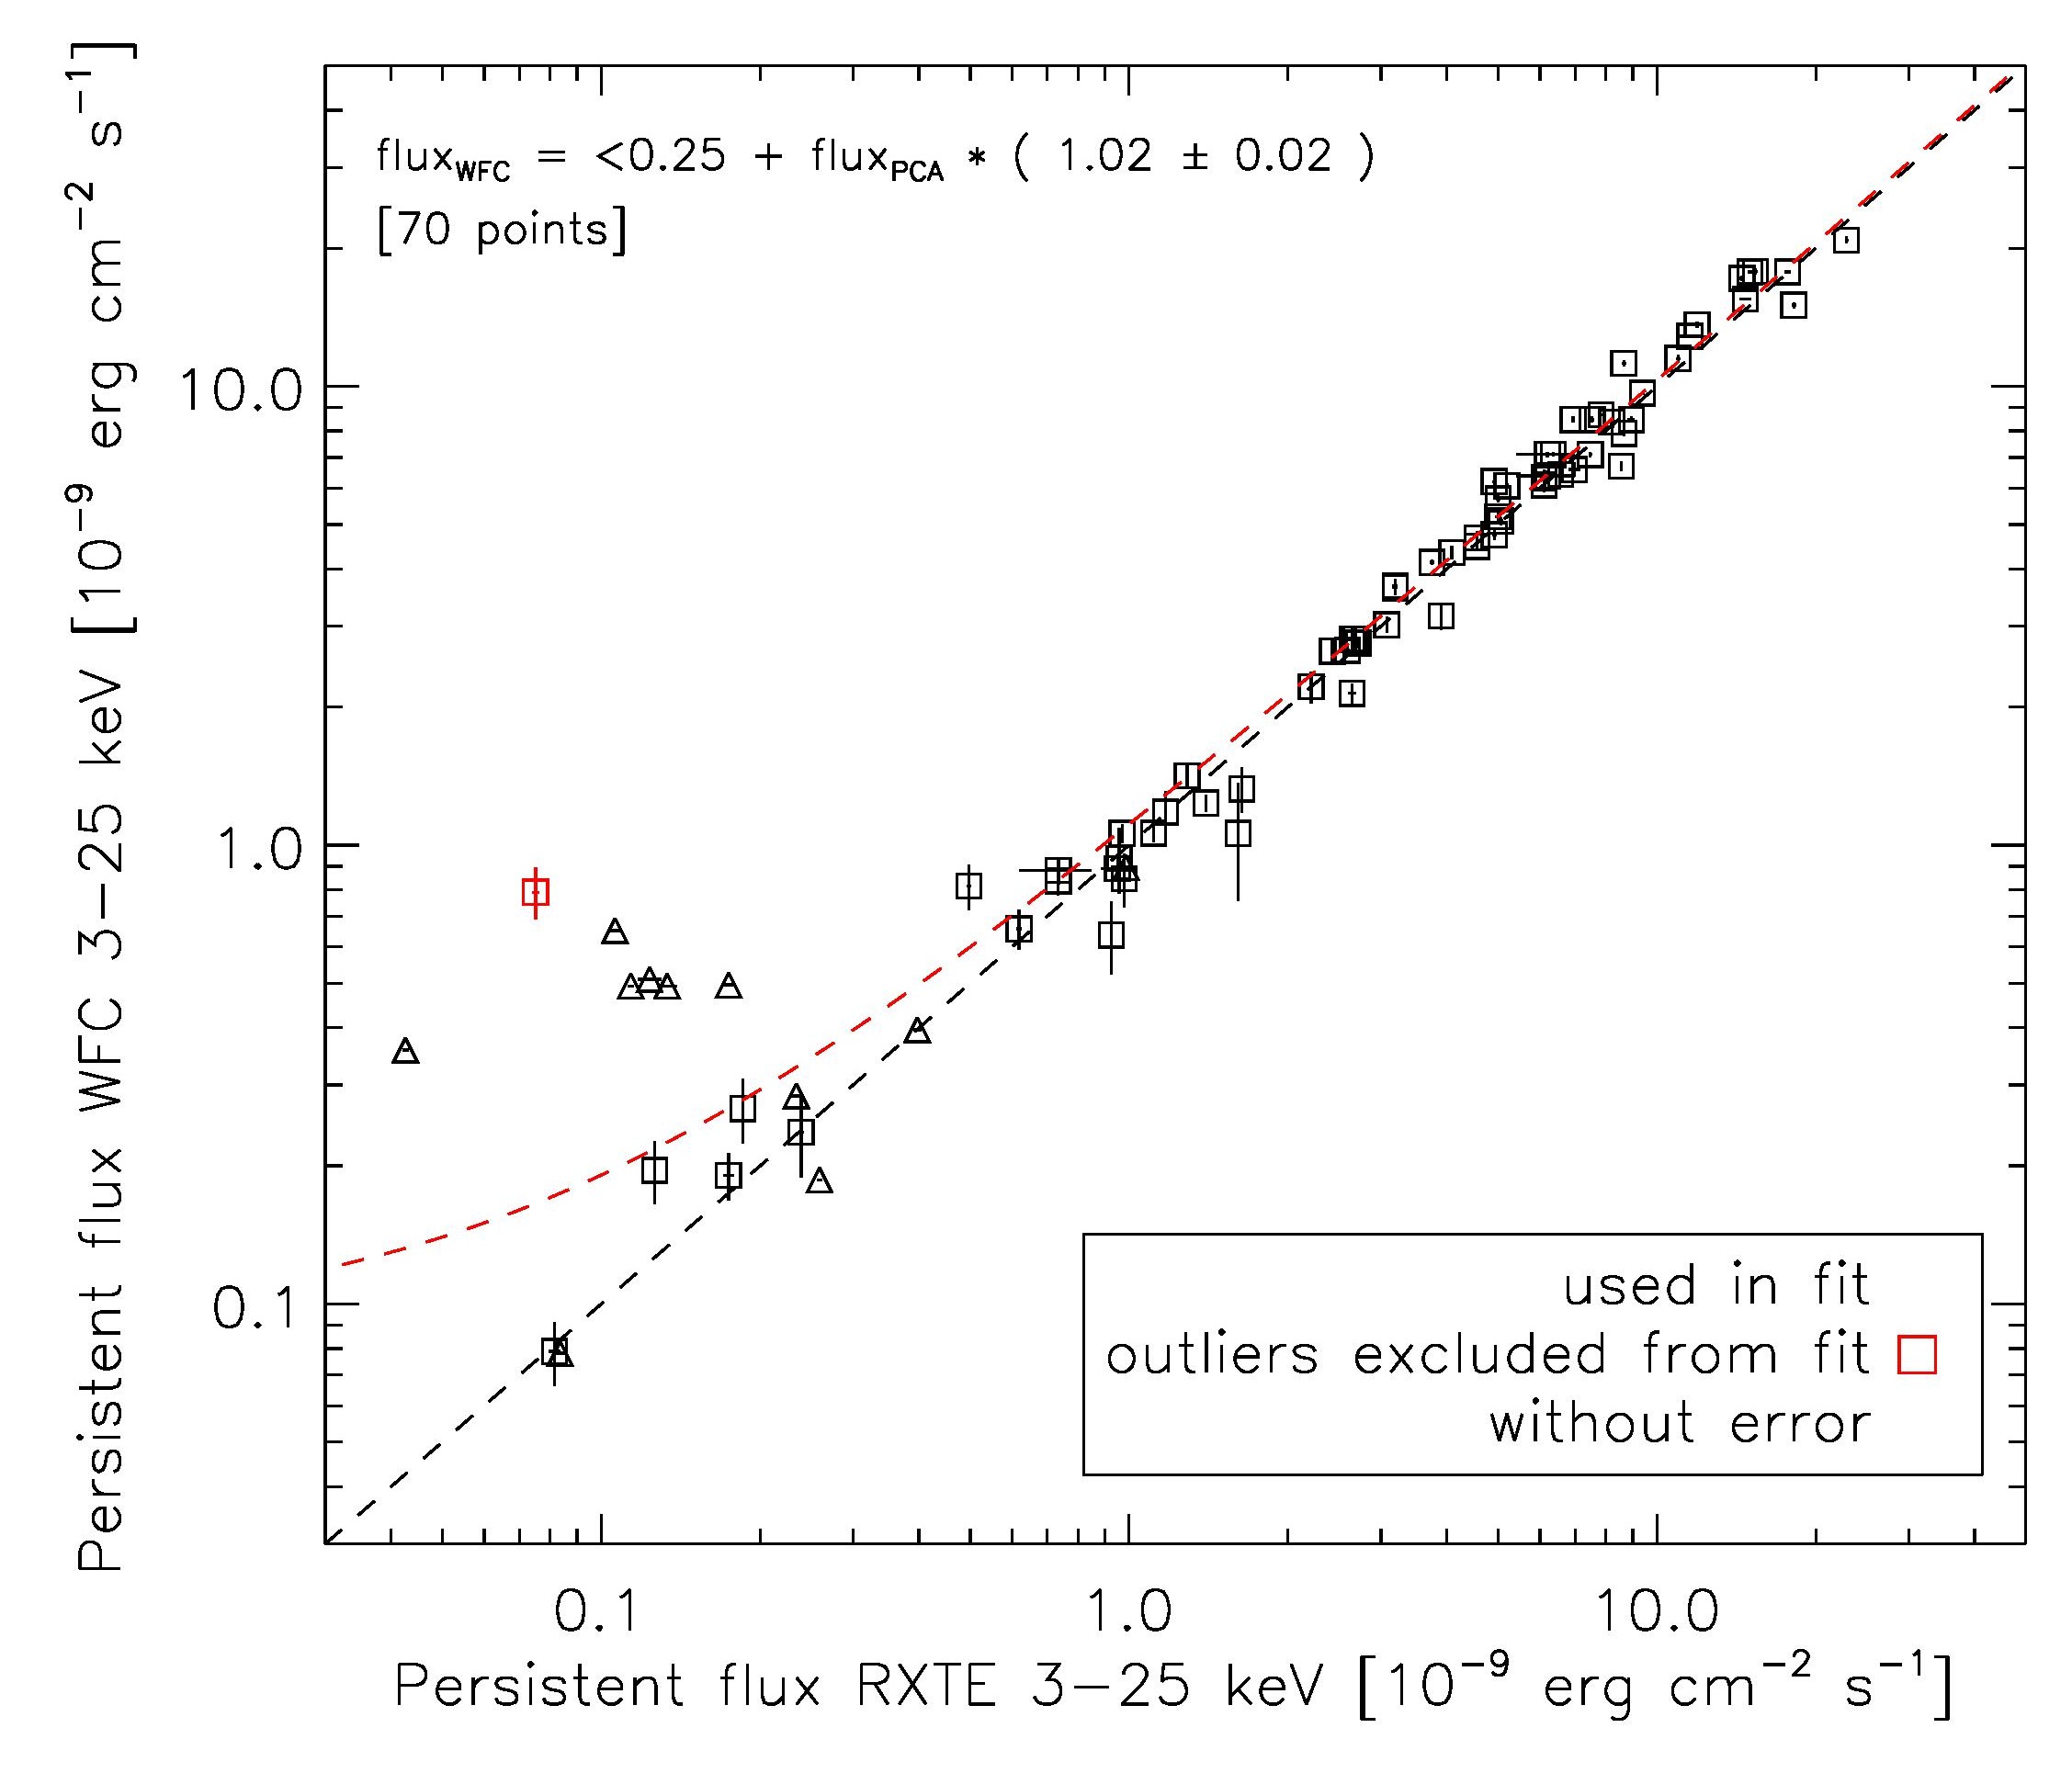 The points marked in red are identified as outliers, and are excluded from the linear fit, which gives: $ F_\mathrm{WFC} = (0.09 \pm 0.16) + F_\mathrm{PCA} \times ( 1.02 \pm 0.02 ) $ Below we list the relevant parameters for the outliers
RXTE-JEM-Xlast updated 2015 October 29 Below is the plot showing the cross-calibration 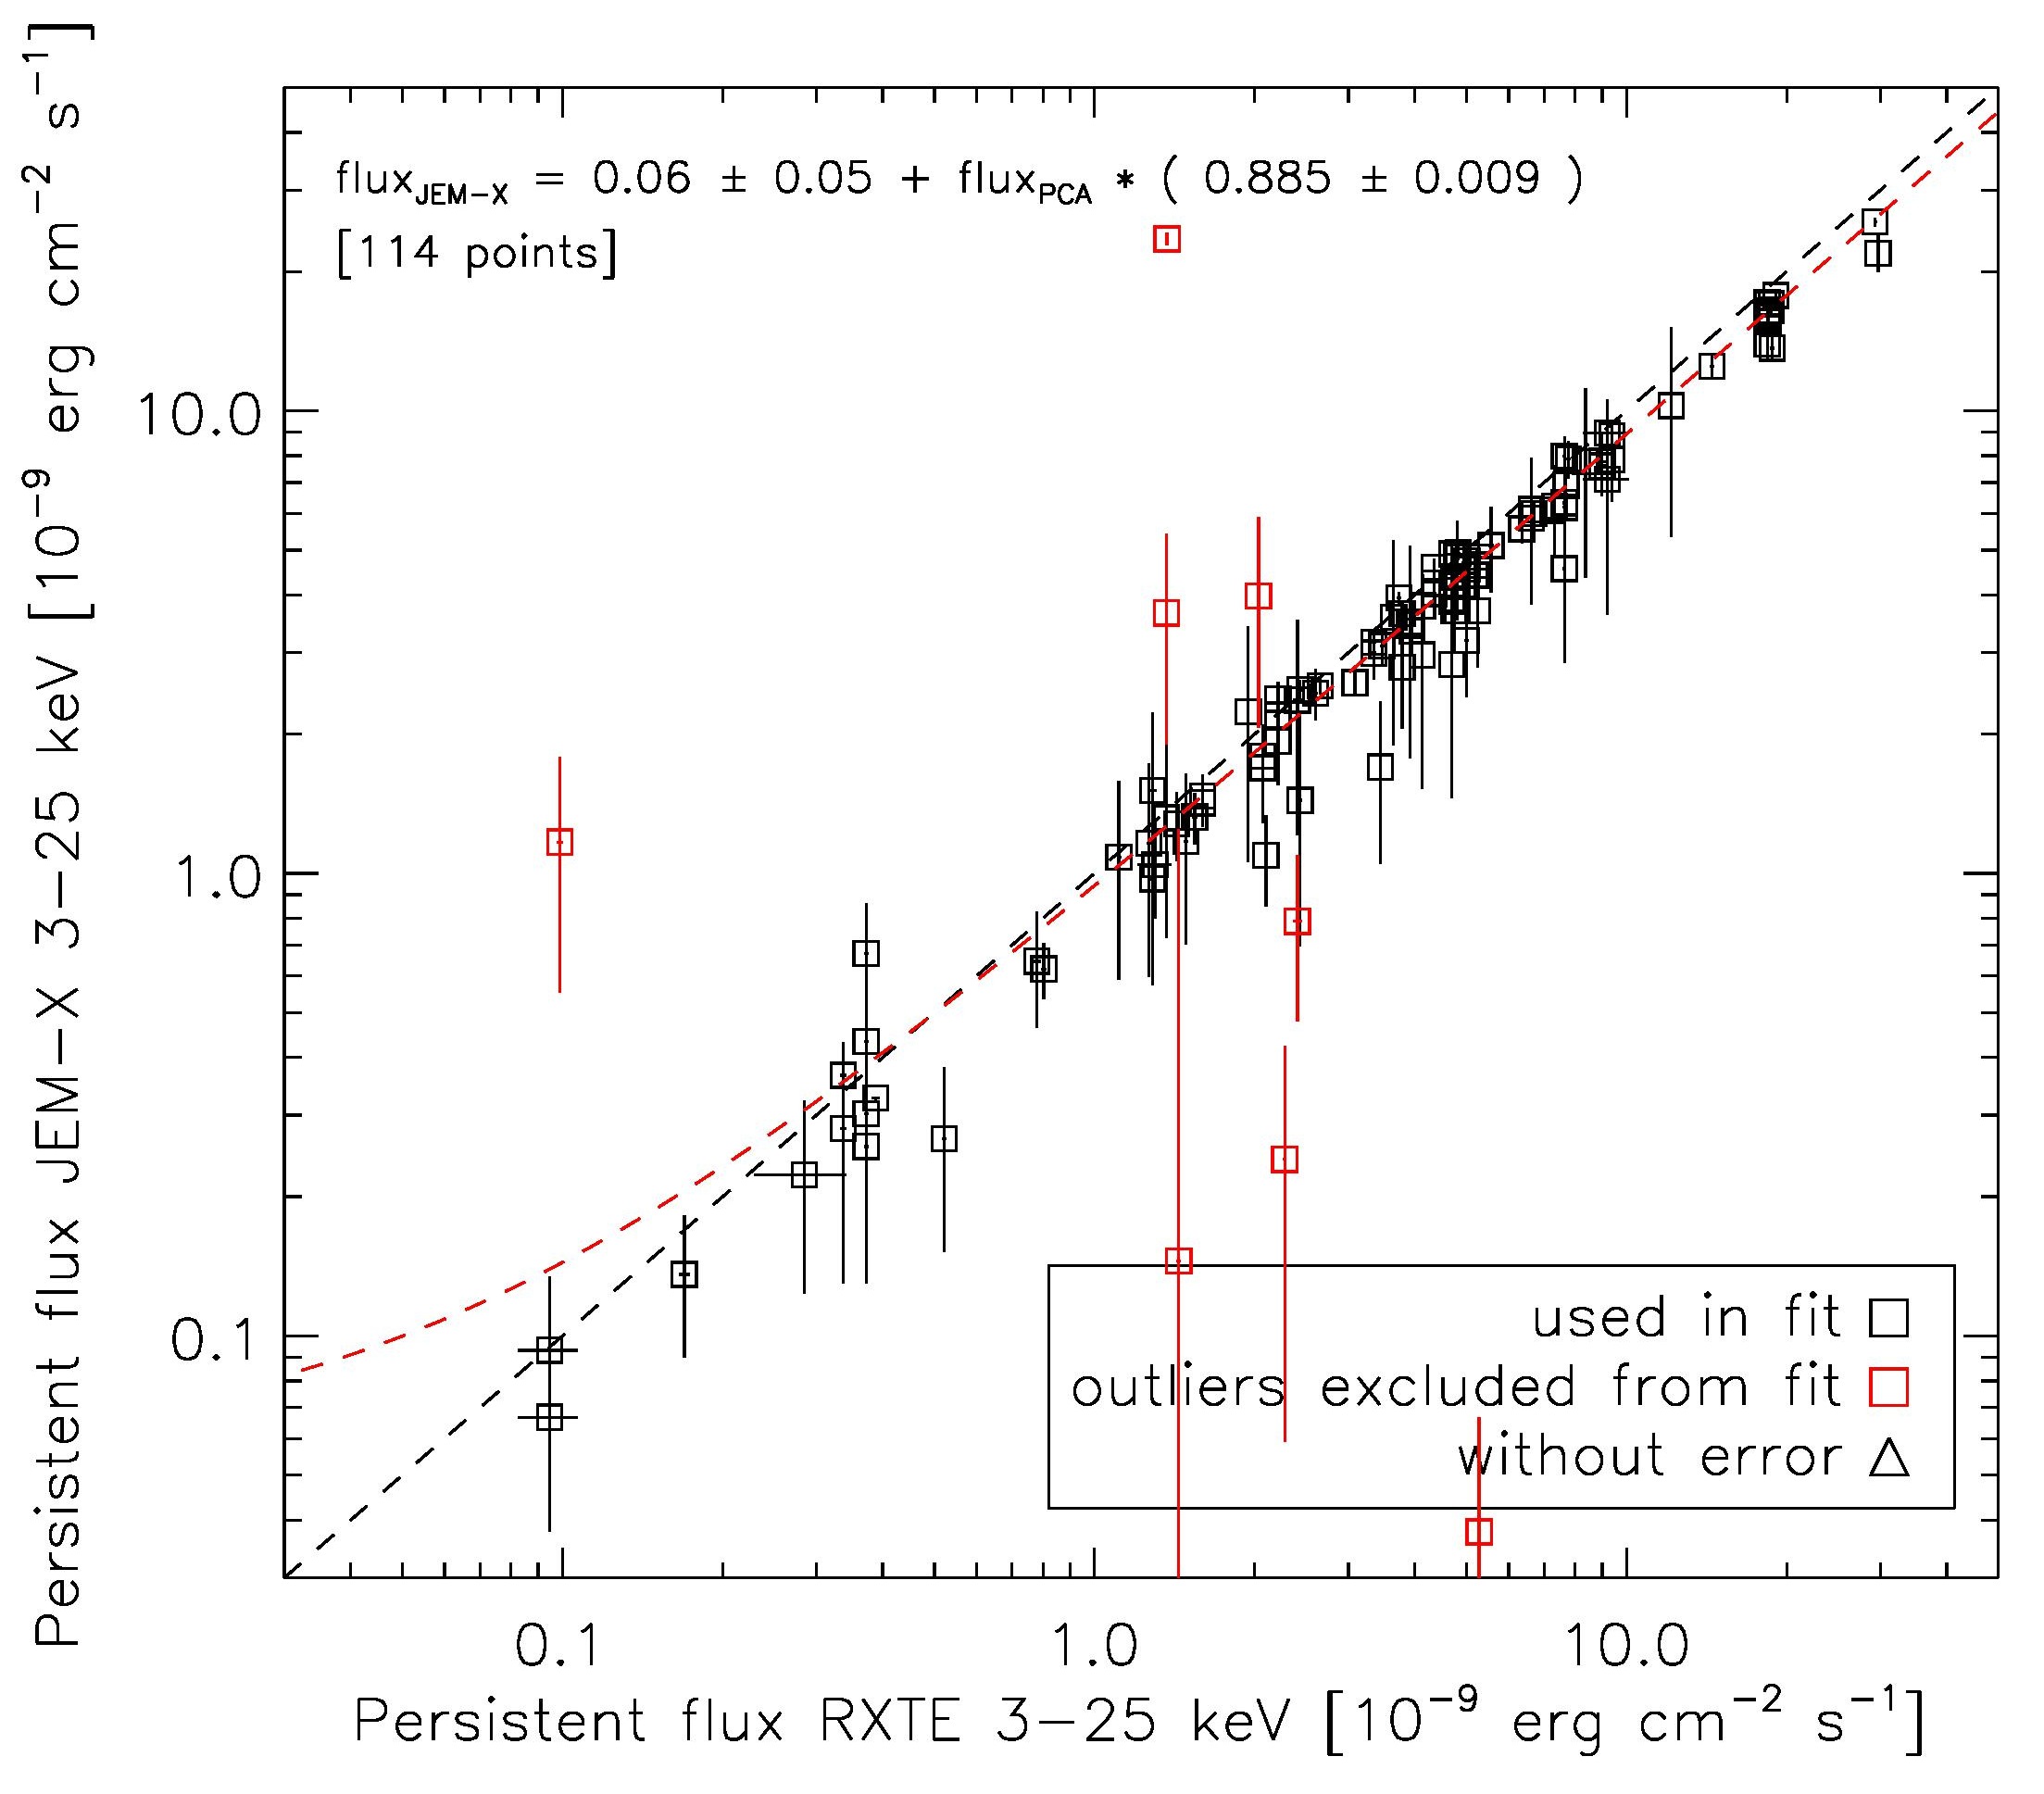 The points marked in red are identified as outliers, and are excluded from the linear fit, which gives: $F_\mathrm{JEM-X} = (0.06 \pm 0.05) + F_\mathrm{PCA} \times ( 0.885 \pm 0.009 ) Below we list the relevant parameters for the outliers
BurstsWe use 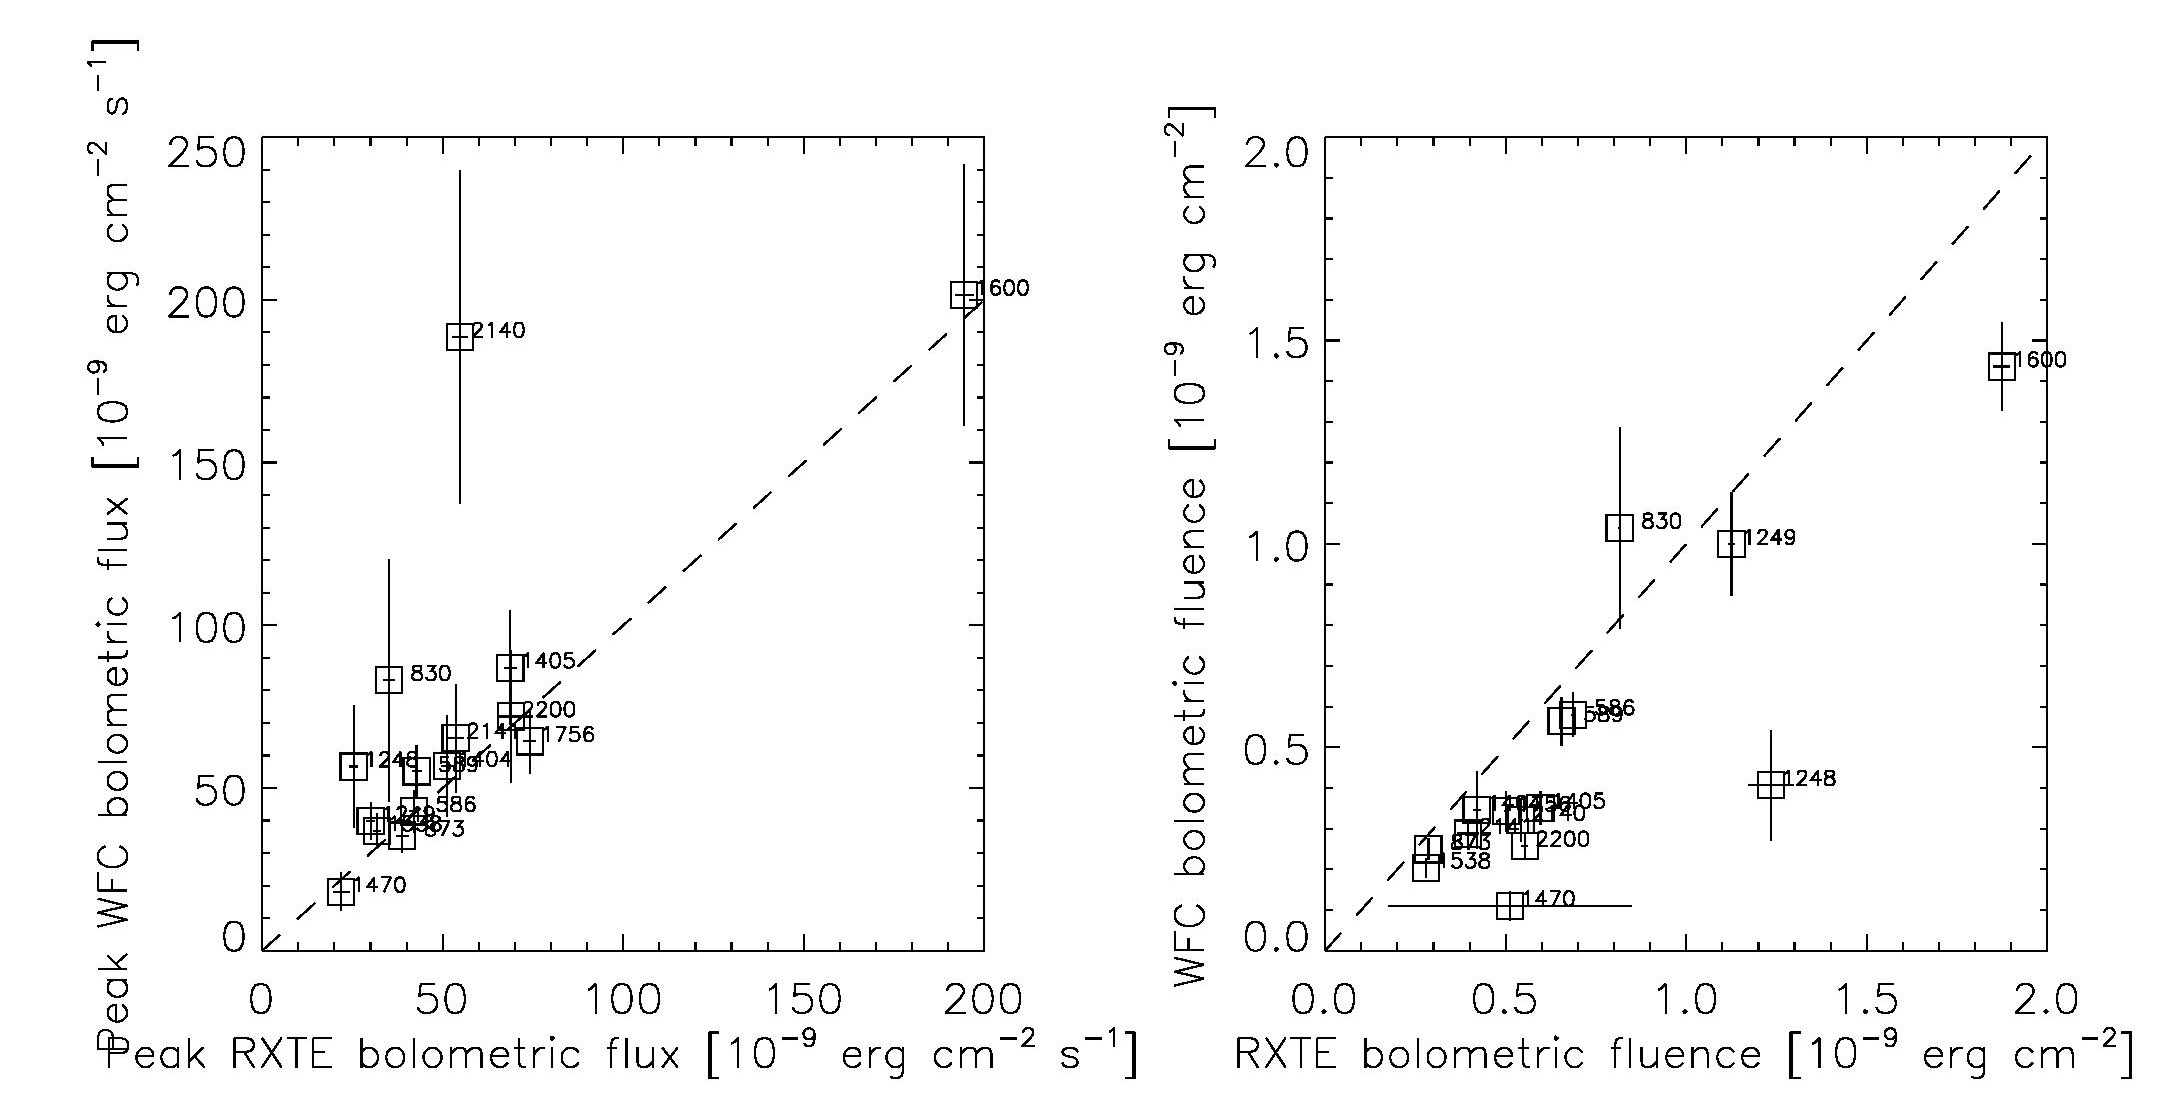 The labels are the burst ID numbers for the WFC bursts |